Development of hydrological database in Upper Ganga basin
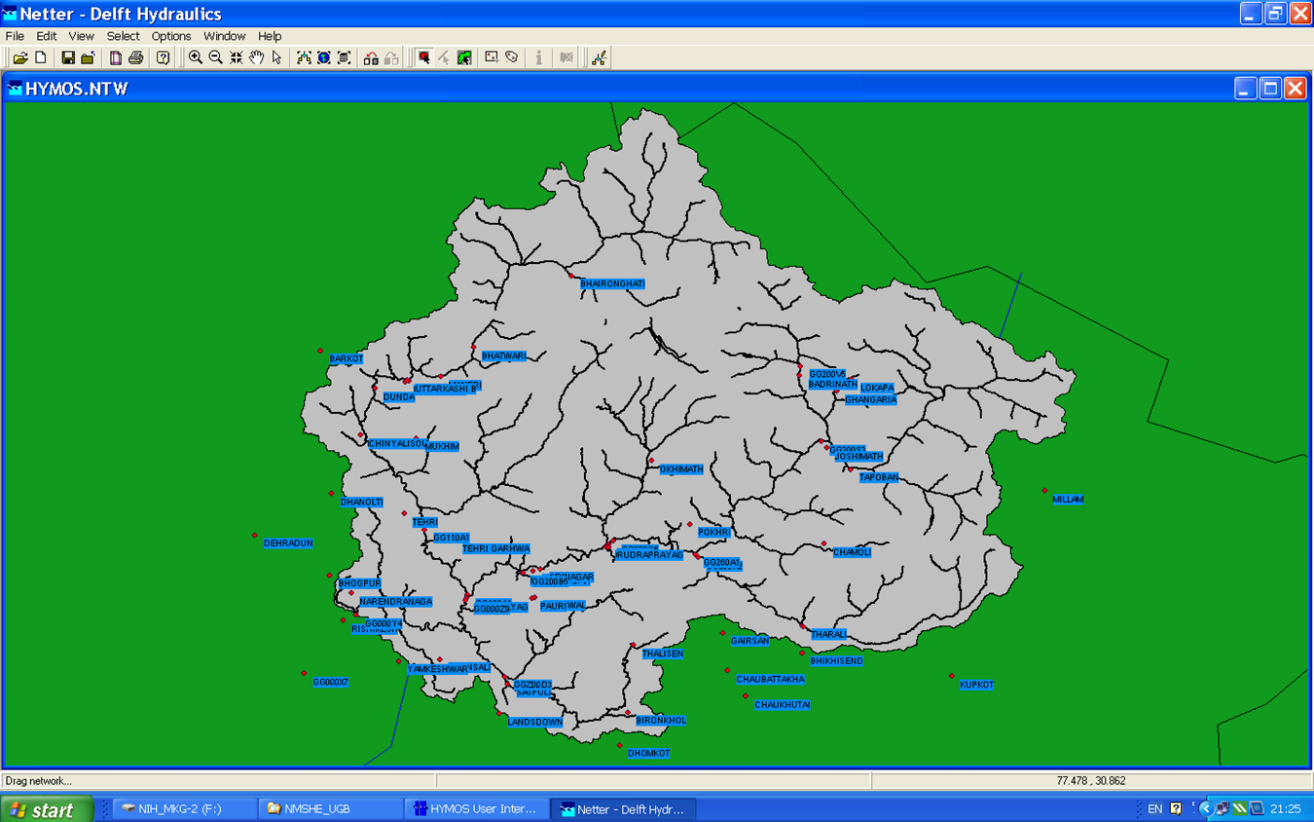
Extensive efforts have been made for the processing of hydro-meteorological data of IMD and CWC. Spatial database for UGB has been developed using the information collected from different sources and different spatial GIS features of UGB have been prepared which include boundary of study basin, drainage map, contour map, district map, soil map, land use map, springs map, village map, rainfall stations map, G&D stations of CWC map and their sub-basins etc. Comprehensive database of temporal hydro-meteorological observations in the study basin has been developed with database of IMD for precipitation (47 stations) and temperature data (6 stations) and with database of CWC for various data such as precipitation (11 stations), temperature, river flow (15 stations), water quality parameters (9 stations), and cross-section details at different locations. Flow data are restricted and special permission has been granted by CWC for the use of data for present study. Location of various IMD/CWC stations in HYMOS interface is shown in Figure – 1.
All data have been plotted and availability charts have been prepared. Very sparse and non-continuous data availability has been found for some IMD stations and most of them were closed towards the end of last century. On the other hand, most of the CWC stations were started in the decade of 1970s and have consistent and continuous observations without much gaps. In view of these, most of the analysis has been carried out from 1970s decade up to the last available period (1972 to 2016). The stations with little data or with large gaps have been excluded from the analysis. Finally, precipitation time series of 19 IMD stations and 11 CWC stations have been used for data processing for further hydrological analysis.
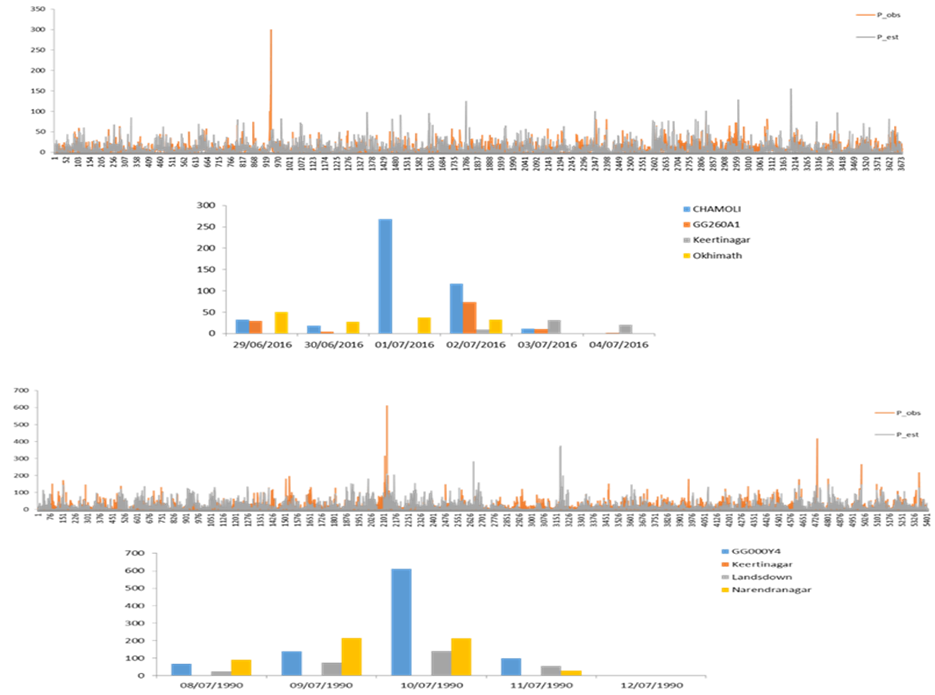
Most of the data processing was carried out in the HYMOS data processing software. Correlation analysis was carried out for all stations with marginal or considerable data length so that correlated stations so that data of such stations could be used for data validation filling-in of the missing records. Subsequently, the gaps in the observed precipitation series of 30 stations were filled using the data of correlated stations with the normal-ratio method from June, 1972 to May, 2016. Rainfall exhibits some degree of spatial consistency. Thus, spatial homogeneity test was performed to identify the outliers in the precipitation data. 24 such events were identified. It is worthwhile to mention that spatial consistency of rainfall is highly affected by the topography and since Himalayan mountains have significant rugged and undulating terrain, it is quite possible that rainfall may vary significantly over small distances. However, it is always recommended to check the flagged observations from some other sources or means for the sake of data validation. One such identified event is shown in Figure – 2.
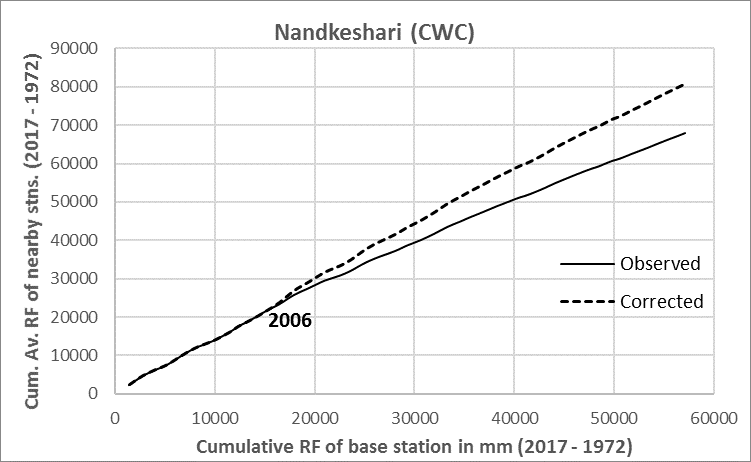
The double mass curve (DMC) is extensively used method to investigate the consistency of hydro‐meteorological time series and the same was used in present case. Graphs were plotted between the cumulative annual rainfall of test station and the cumulative average annual rainfall of neighboring correlated stations 8 stations were found to show significant changes in observed rainfall data since different years (from break point of slope). These stations are: Dhanolti-IMD (1986), Landsdown-IMD (1996), Uttarkashi-IMD (1999), Srinagar-CWC (1985), Badrinath-CWC (2003), Karanprayag-CWC (1991), Marora-CWC (2000), and Nandkeshari-CWC (2006). Based on the change in slopes, the corrections were made in the historical data period so as to represent the consistent rainfall observations during the period 1972 – 2016. The double mass curves for Nandkeshari station is shown in Figure – 3.
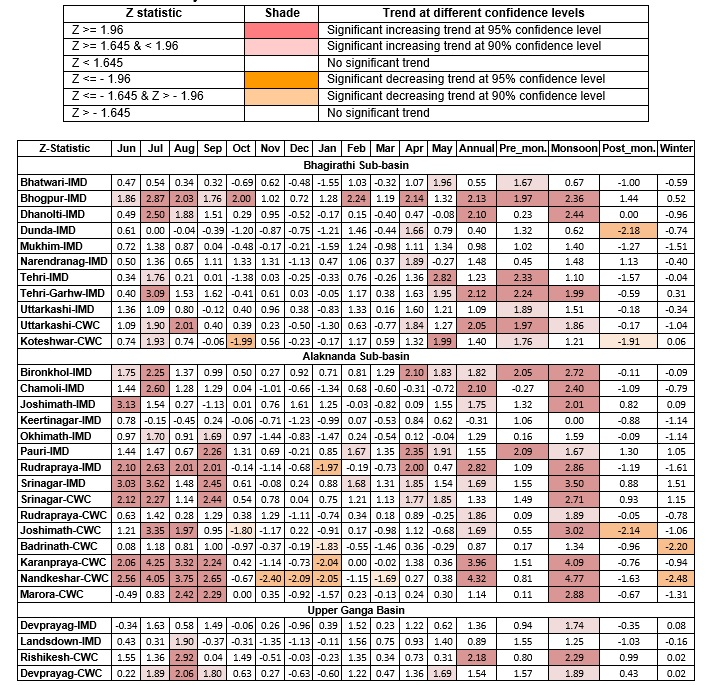
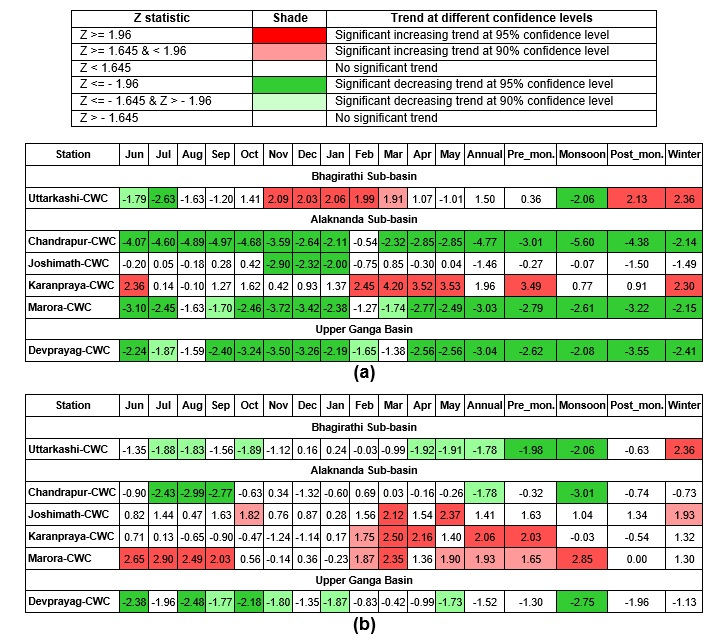
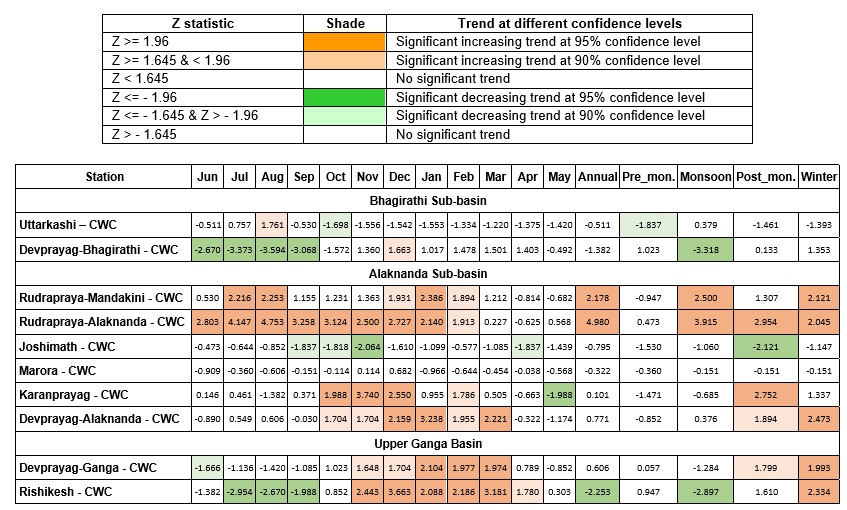
The precipitation and temperature are the two major influential factors in climate change studies as well as in hydrologic cycle. Trend analysis has been carried out on different hydro-meteorological variables at monthly, seasonal and annual time scales using modified Mann–Kendall test. The results of trend analysis for precipitation, max./ min. temperature and river flows are shown in Figure – 4 to 6 respectively.
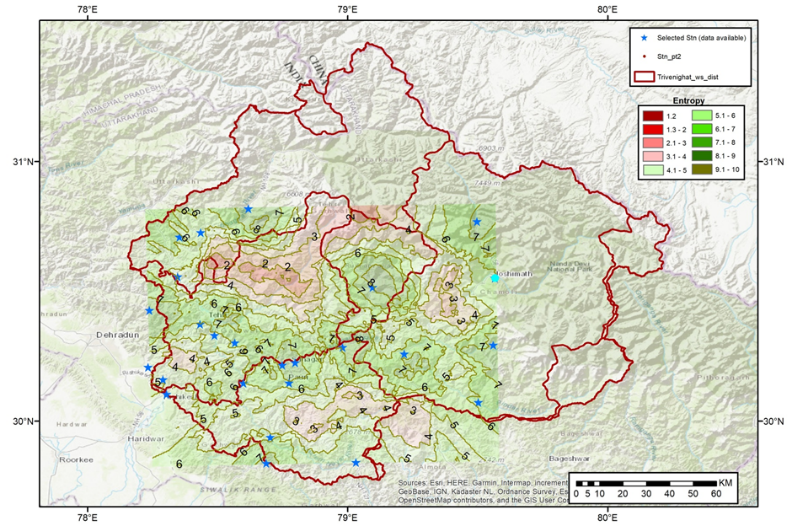
Network analysis of hydro-meteorological stations in UGB has been carried out. Since the area of the UGB below the 4000 m elevation is 14000 sq. km, it is expected that 56 stations (considering a density of 250 sq. km per station) as per BIS guidelines would be able to capture the rainfall variation in the basin. Based on the ‘Coefficient of Variation (Cv)’ analysis, it is found that present network of stations is sufficient to capture the variability of rainfall in UGB. It is suggested that all the stations (around 47 in number) installed earlier in the basin may be re-established and may be equipped with sensors for measurement of meteorological variables in the rugged terrain of Himalayas so as to capture the variability. Entropy, which represents value of information, analysis has been carried out with the available data of 30 stations and desirable locations of additional stations is suggested as shown in Figure – 7.
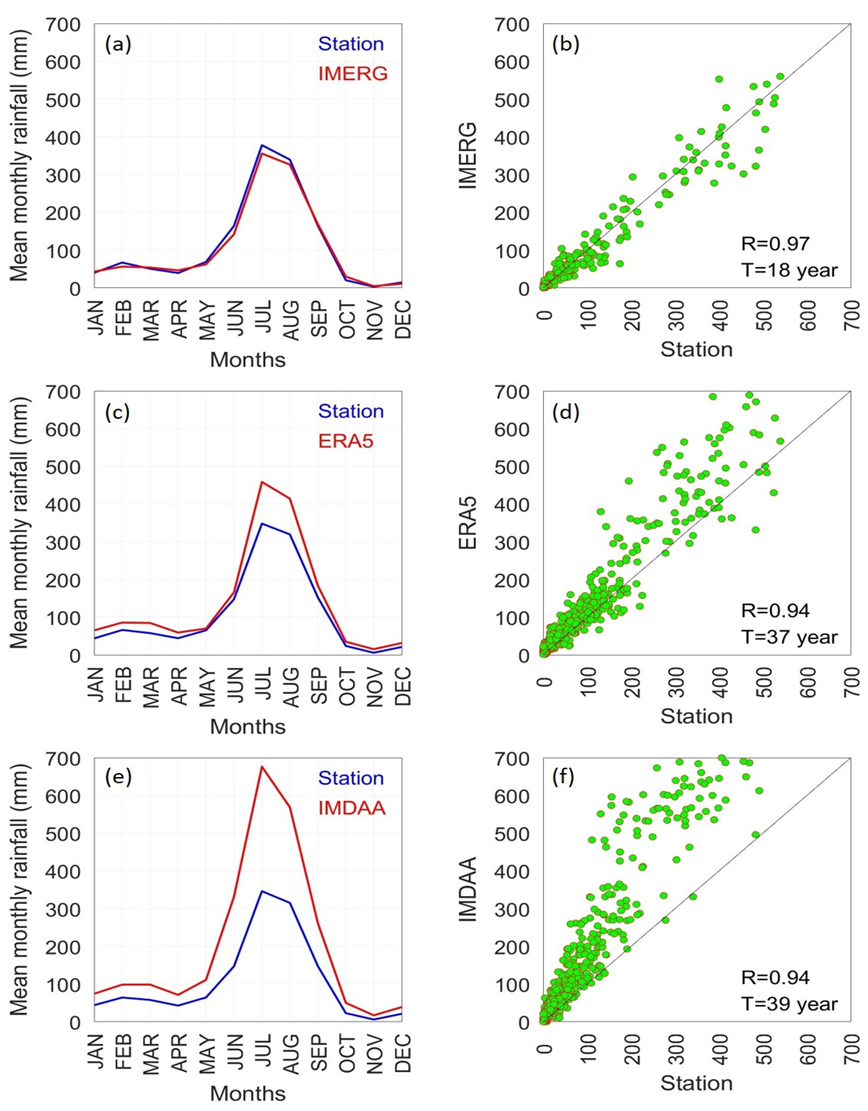
With advancement in technology, the manual intervention and station-based data recording has been overcome to a greater extent wherein an array of precipitation products have been developed by researchers across the globe using sophisticated techniques and made available to the scientific community. To explore the potential usage of global precipitation estimates available from reanalysis products or satellite estimates, two reanalysis products, i.e. ERA5-Land hourly data, IMDAA daily dataset, and precipitation estimates from GPM-IMERG were utilized. To analyze the skills of these precipitation estimates, the comparison was done at monthly scale wherein the areal monthly rainfall time series were created and analysed for UGB by creating the mean areal estimates and grid wise manner. Different performance indices, viz. Pearson correlation coefficient (r), Nash-Sutcliffe efficiency (NSE), Percent bias (PBIAS), and Root-mean-squared-error (RMSE) were employed to assess the skills along with graphical method to visualize the skills of these products in resolving the seasonal precipitation climatology. Though all these products were found to capture the seasonality of precipitation regime of UGB, only IMERG is found to be satisfactorily representing the monthly magnitudes as shown in Figure – 8.