Glacial Lakes & Glacial Lake Outburst Flood in Western Himalayan region
Glacial hazards relate to hazards associated with glaciers and glacial lakes in high mountain areas and their impacts downstream. The climatic change/variability in recent decades has made considerable impacts on the glacier lifecycle in the Himalayan region. As a result, many big glaciers melted, forming a large number of glacial lakes. Due to an increase in the rate at which ice and snow melted, the accumulation of water in these lakes started increasing. Sudden discharge of large volumes of water with debris from these lakes potentially causes Glacial Lake Outburst Floods (GLOFs) in valleys downstream. Outbursts from glacier lakes have repeatedly caused the loss of human lives as well as severe damage to local infrastructure. In this study, glaciers and glacial lakes have been mapped using satellite data since the year 1990 with the integrated application of visual and digital image analysis along with Geographic Information System. Four river basins of Western Himalayan region, namely Upper Ganga river basin up to Rishikesh, Satluj river basin, Chenab river basin, and Beas river basin have been selected.
Landsat imagery has been used to delineate the glacier boundary in the basins and glacier maps have been prepared. Semi-automatic digitization approach has been used to delineate the exact boundary of glaciers. Landsat 5, Landsat 8 image (August - October, 1990, 2000, 2014, and 2019 with band combinations R G B 6 4 3 were visualised. This band combination was used to make a clear differentiation among various terrain classes (snow, glacier, ice, vegetation, lake). The SWIR band is used to discriminate cloud and snow. The unique reflectance of snow-ice, shape of the valley occupied by the glacier, the flow lines of ice movement of glaciers, the rough texture of the debris on the ablation zone of the glaciers, the shadow of the steep mountain peaks and presence of vegetated parts of the mountains help in clear identification of a glacier on the satellite image. To estimate change in glacial area, the two layer of glacier extent are overlaid on each other. Flow chart of methodology adopted to identify glaciers is shown in Figure – 1.
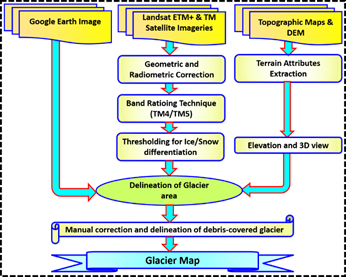
The changes in glaciated areas in different basins and zoomed-in areas are illustrated in Figures – 2 to 5. Estimated changes in number of glaciers and glaciated areas is shown in Table – 1.
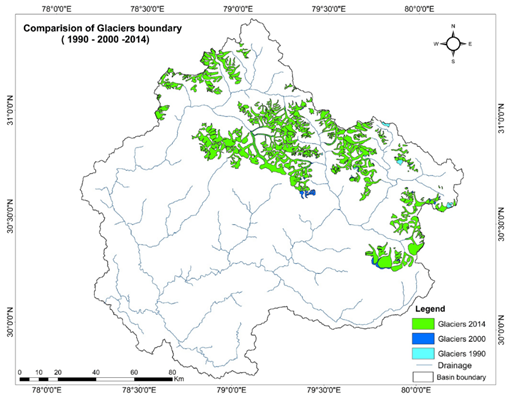
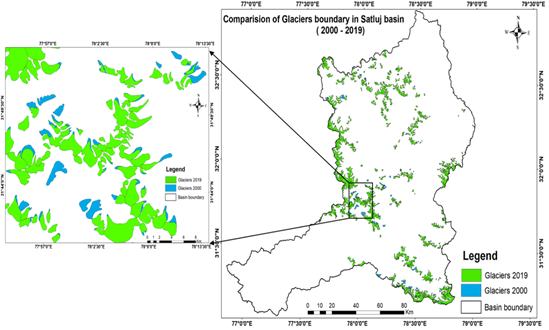
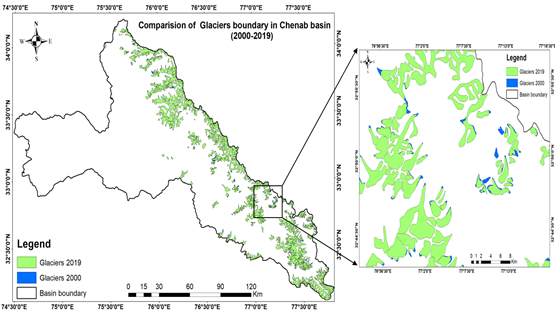
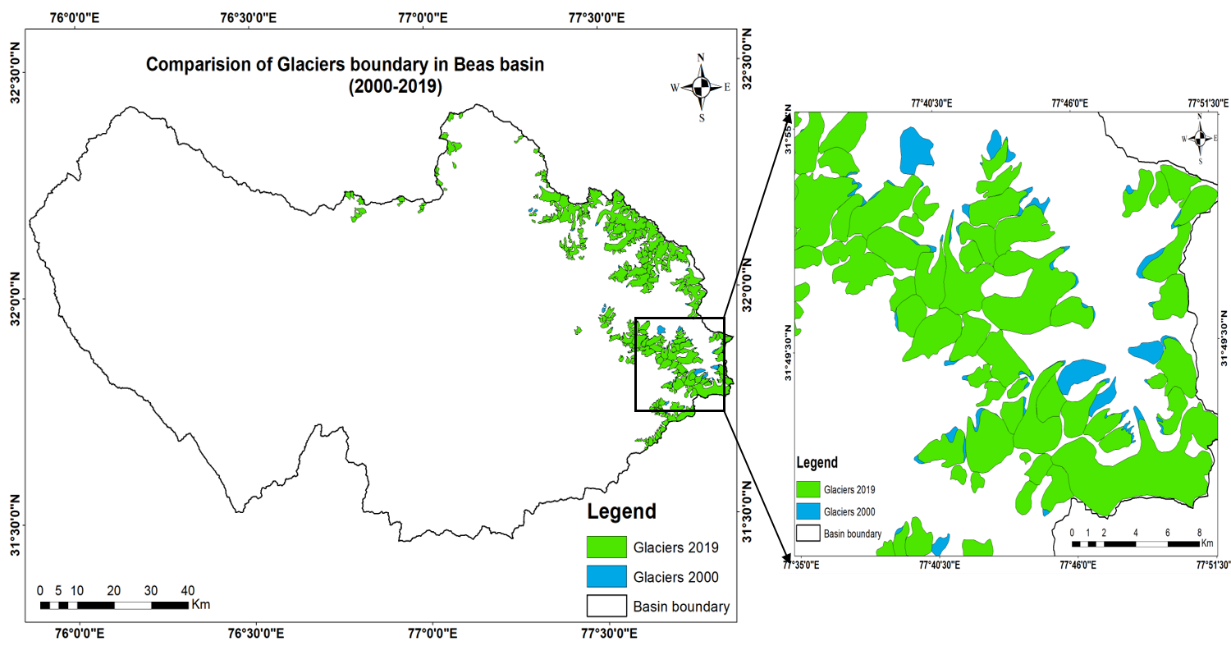
Table – 1: Change in glaciated area in four study basins during 2000 to 2019
| Year | UGB | Chenab Basin | Satluj Basin | Beas Basin | ||||
|---|---|---|---|---|---|---|---|---|
| No. of Glaciers | Area (sq. km) | No. of Glaciers | Area (sq. km) | No. of Glaciers | Area (sq. km) | No. of Glaciers | Area (sq. km) | |
| 2000 | 311 | 1918.4 | 403 | 2586 | 695 | 1263.15 | 218 | 649.505 |
| 2019 | 281 | 1756 | 395 | 2536 | 652 | 1163.45 | 208 | 628.192 |
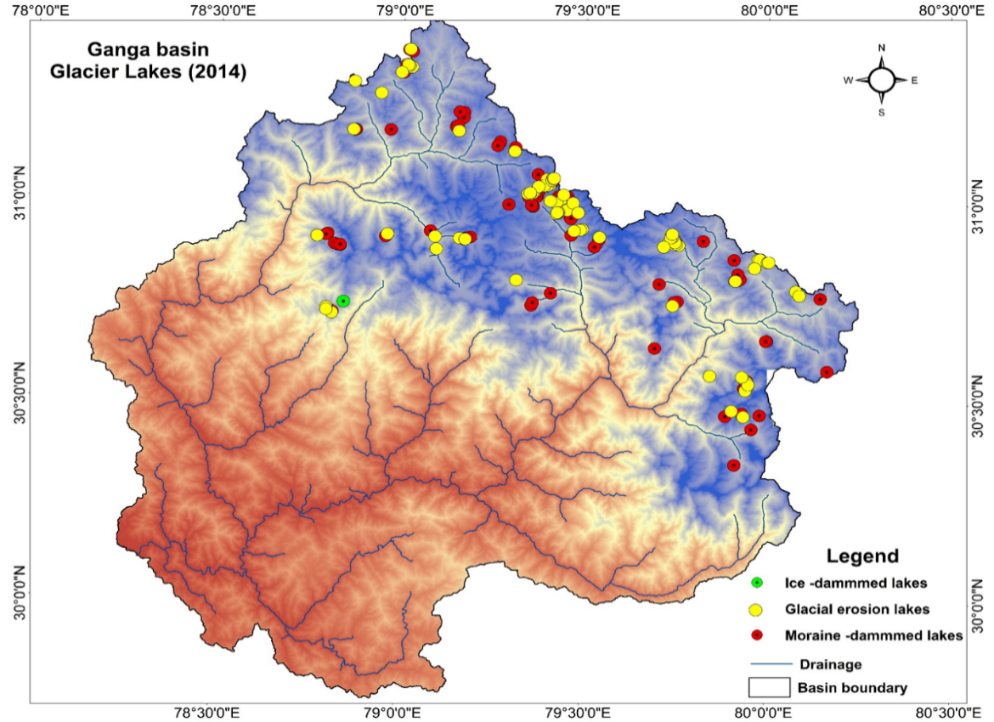
A glacial lake is a water mass existing in sufficient amount and extending with a free surface in, under, beside, and/or in front of a glacier and originating from glacier activities and/or retreating processes of a glacier. Due to the rapid rate of ice and snow melt, possibly caused by global warming, accumulation of water in these lakes has been increasing rapidly in Himalayas. The lakes located at the snout of the glacier are mainly dammed by the lateral terminal or end moraine, where there is high probability of breaching. Such lakes could be dangerous as they may hold a large quantity of water. Breaching and the instantaneous discharge of water from such lakes can cause flash floods enough to create enormous damage in the downstream areas. In order to assess the possible hazards from glacial lakes, it is essential to have a systematic inventory of all such lakes formed at the high altitudes. This is feasible by identifying them initially through satellite images (and aerial photographs, if available) and to assess their field setting subsequently. Besides making a temporal inventory, a regular monitoring of these lakes is also required to assess the change in their nature and aerial extent. In this study, inventory of glacial lakes in four study basins have been prepared. The lakes have been categorized into Glacial-erosion, Moraine-Dammed and Ice-dammed lakes. NDWI (Normalized Difference Water Index) along with DEM information has been utilized to identify glacial lakes as shown in Figure – 6. The number of glacial lakes identified in four study basins are given in Table – 2. A map of glacial lakes in Upper Ganga basin is illustrated in Figure – 7.
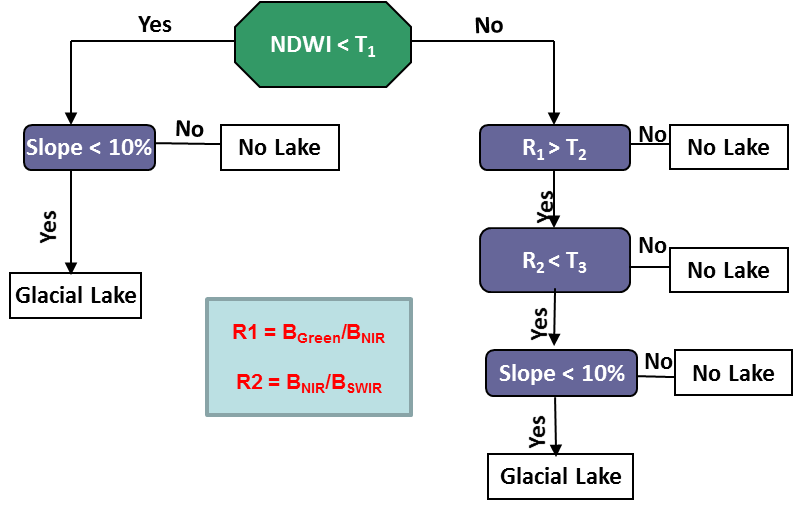
Table – 2: Number of identified glacial lakes in four study basins
| Year | Ganga Basin | Chenab Basin | Satluj Basin | Beas Basin |
|---|---|---|---|---|
| 1990 | 139 | 57 | 30 | 12 |
| 2000 | 168 | 89 | 41 | 47 |
| 2008 | 182 | 86 | 25 | 32 |
| 2014 | 187 | 89 | 36 | 40 |
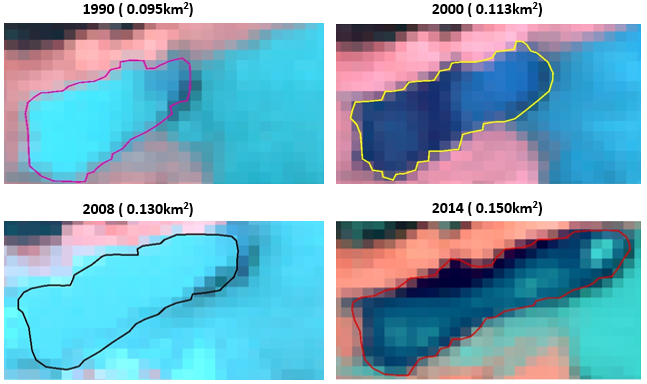
Factors contributing to the hazard / risk of moraine-dammed glacial lake include (a) large lake volume, (b) narrow and high moraine dam, (c) stagnant glacier ice within the dam, and (d) limited freeboard between the lake level and the crest of the moraine ridge. Different triggering mechanisms of GLOF events depend on the nature of the damming materials, the position of the lake, the volume of the water, the nature and position of the associated mother glacier, physical and topographical conditions, and other physical conditions of the surroundings. Interaction between these processes may strongly increase the risk of hazards. The most significant chain reaction in this context is probably the danger from ice avalanches, debris flows, rockfall or landslides reaching a lake and thus provoking a lake outburst. A view of the potentially dangerous glacial lake in Ganga basin as seen in Landsat image is shown in Figure – 8.
For identification of potentially dangerous (PD) glacial lakes, the glacial lakes associated with glaciers like supra-glacial lakes and/or dammed by lateral moraine or end moraine with an area larger than 0.02 sq.km have been considered and they have been defined as major glacial lakes. As per the assessment from some of the criteria’s, as such there is no lake which falls in the category of vulnerability in Ganga basin but the lake with increasing area over the years is identified as PD. The area of this lake comes out to be 182000 sq. m for the year 2019. As per the standard criteria, two lakes have been found as vulnerable lakes in Chenab basin. The area of the most vulnerable lake comes out be 1474271 sq m for the year 2019. In Satluj basin there are two lakes which falls under the category of vulnerable lakes. In Beas basin, there two vulnerable lakes. As per the assessment from some of the criteria’s, two vulnerable Lake have been identified to have a relatively higher potential for occurrence of GLOF in Beas basin. The area of these lakes in 2014 are 0.1271 and 0.0476 sq. km. Number of commercial software are available for carrying out dam break modelling. In the present study, HEC¬RAS version 5.0.7 model developed by Hydrologic Engineering Center of U. S. Army Corps of Engineers has been selected. GLOF modeling for Alaknanda glacial lake in UGB is briefly illustrated below:
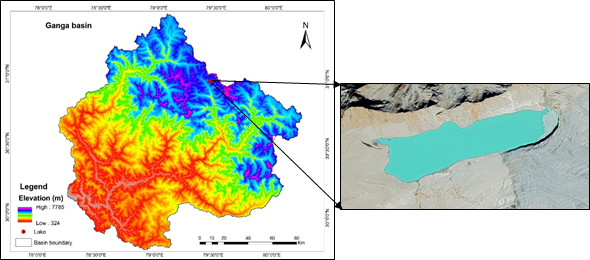
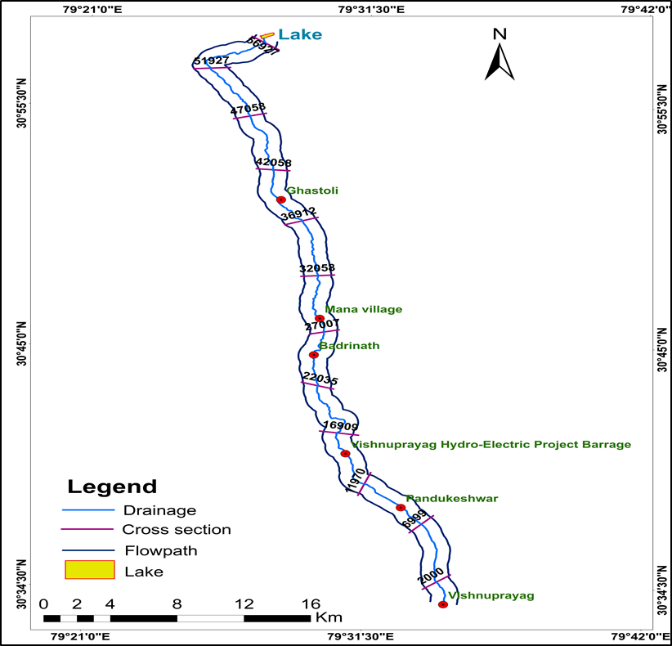
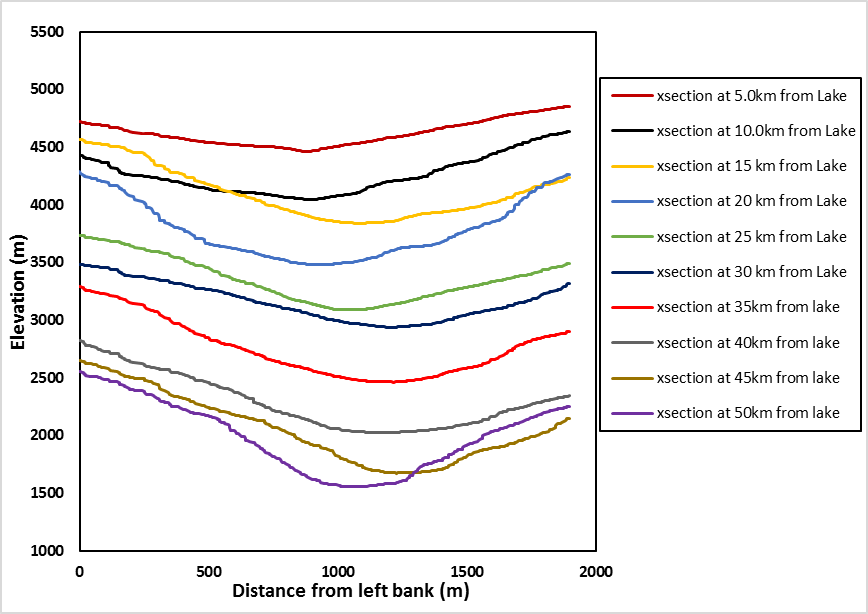
GLOF simulation study has been carried out for PD Lake found near Ghastoli - Ratakona in Alaknanda basin (with area of 182,000 m2 and altitude of 5558 m) as shown in Figure – 9. The Alaknanda river from glacial lake location down to the outlet has been represented in HECRAS by a number of cross-sections (Figure – 10 (a & b) at an interval of 5 km, developed from SRTM DEM.
The GLOF has been routed through the Alaknanda River from upstream to downstream, including different project sites. Different breach widths (40m, 60m and 75m) have been taken along with different breach formation times (40, 30 and 20 min for 40, 60 and 75 m breach width respectively) and six hypothetical one-dimensional moraine breach simulations have been performed with varied breach width (Bw) and breach formation time (Tf).
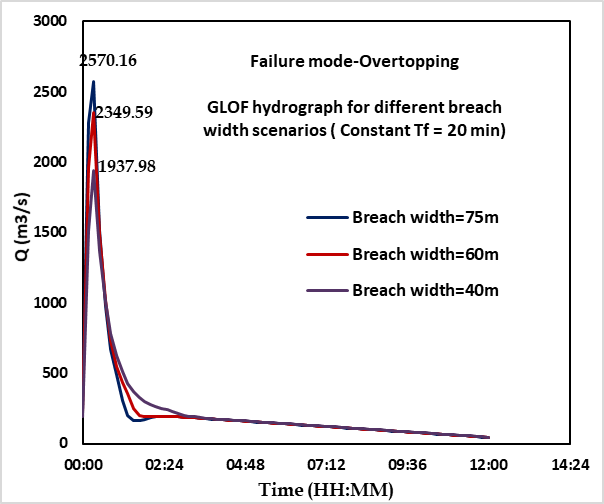
The flood hydrographs at downstream of the lake at different sites across the river are shown from Figure – 12 (a – e).
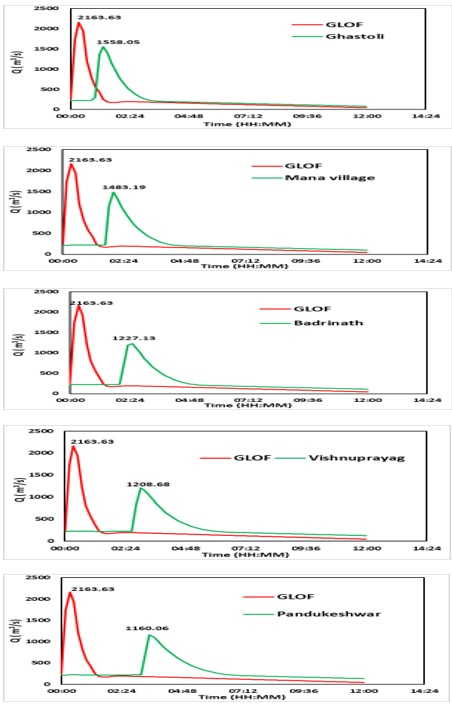
Hazard reference values such as depth, velocity, water surface elevation and flood peak arrival time are computed as shown in Table – 3 for various affected locations
Table – 3: Settlement hazards due to GLOF of Alaknanda Lake
| Settlement ID | Distance from Lake (km) | Maximum Discharge (m³/s) | Depth Maximum (m) | Velocity Maximum (m/s) | WSE Maximum (m amsl) | Flood Peak Arrival Time (HH:MM) |
|---|---|---|---|---|---|---|
| Ghastoli | 12 | 1558.05 | 6.88 | 2.56 | 3970.87 | 1:20 |
| Mana Village | 23.5 | 1483.19 | 6.19 | 3.74 | 3136.44 | 2:00 |
| Badrinath | 28 | 1227.13 | 10.85 | 2.38 | 3079.10 | 2:30 |
| Vishnuprayag Hydro Project | 38 | 1208.68 | 7.12 | 3.21 | 2265.31 | 3:00 |
| Pandukeshwar | 44 | 1160.49 | 5.62 | 2.73 | 1859.02 | 3:30 |
| Vishnuprayag | 50 | 1118.59 | 12.82 | 3.99 | 1494.89 | 4:10 |
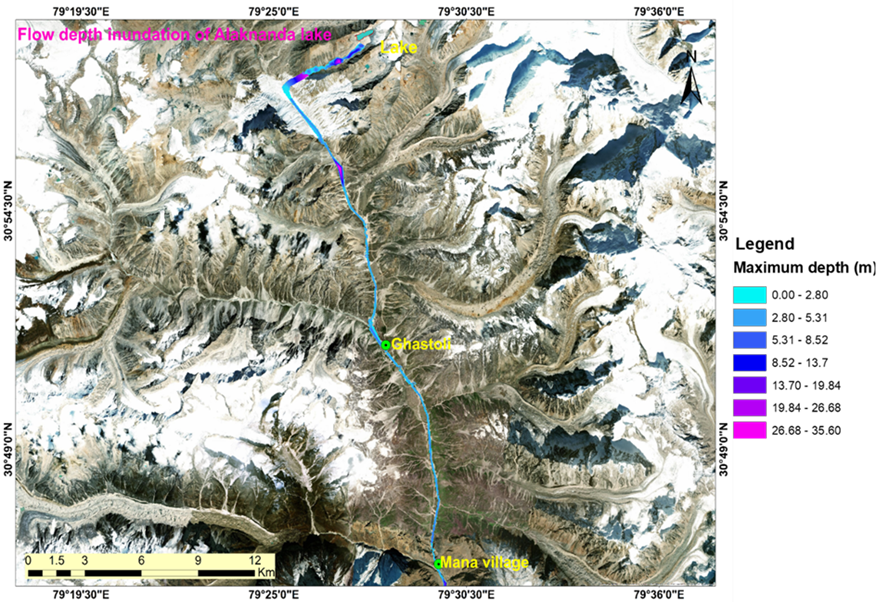
Using the results of one-dimensional flow analysis, inundation maps have been prepared showing the areas subject to flooding from a GLOF. The maps contain profiles of the peak flood levels expected, as well as an estimation of the time from the beginning of the breach to the moment the location start to get inundated. The flood inundation map on Google map is shown in Figure – 13.
Similarly, GLOF modelling has been carried out for vulnerable lakes of Satluj, Chenab and Beas basins.