Study of river-aquifer interactions and groundwater potential in UGB up to Dabrani
Surface and ground water interactions and their dynamics in hilly terrain are complex in nature and depend on topography, river hydraulics, aquifer geometry, geological and hydraulic setups. It is difficult to demarcate the influent and effluent stretches of a river in topographically varying river-aquifer system. Groundwater recharge in the snow dominated area/season is governed by the snow cover extent and duration. Reduction in both the snow cover extent and duration in association with increased winter temperature is an identified climate change response of the western Himalayan region. Weathered material along the hill slopes and sediment deposits in the valley portions form enough space to accommodate the water from snowmelt and rainfall recharge. Because of tectonic activities in Himalayas, fractures are developed in the rocks, which act as conduits for groundwater movement and recharge. In sedimentary rocks, porous and permeable soils and rocks form potential aquifers that receive and hold enough water from snowmelt.
This study was carried out to understand the river-aquifer interaction and dynamics processes in Himalayan environment and to assess the groundwater potential and availability prospects from snow and glacier melt recharge. The study area encompasses the Bhagirathi basin up to the Dabrani bridge, which falls in the Uttarkashi district (with area of 3,487 sq. km).
Geologically, the study area lies in the Extra-Peninsula or Himalaya, which is formed due to collision of the Indian and Eurasian plates during tertiary period. South Tibetan Detachment (STD), Main Central Thrust (MCT), Main Boundary Thrust (MBT) and Himalayan Frontal Thrust (HFT) are the major thrusts from North to South developed due to this convergence and divide the Himalaya into four distinct physiographic-lithotectonic terrains (Gansser, 1964). Siwalik or Outer Himalaya, Lesser Himalaya, Higher Himalaya or Great Himalaya and Tethys Himalaya are the major lithotectonic terrains. The area between Dabrani to Gangotri occupies a part of the Higher Himalayan Zone of Uttarakhand Himalaya, which in itself is a part of the Western Himalayan orogen. The combined effect of rainfall and tectonic instability in area causes excessive land sliding in the region. Drainage pattern of the Bhagirathi catchment up to the Dabrani is trellis to sub-trellis type. In this type of drainage pattern, all tributaries join main stream at right angle. Trellis drainage pattern is the characteristic of folded mountains. Tributary rivers are flowing through the steep valleys whereas Main River, Bhagirathi, through the less steep but ‘V’ shaped valleys. Gorges are present at many places such as near the Lanka and Bhaironghati. These gorges are developed in highly jointed granitic rocks having two sets of joints cutting each other at right angles. Glacial deposit e.g. moraine was traced near Gangotri and Lanka and at several places in between. Same trend, i.e. NW-SE of each moraine, indicates about the similar origin. Thickness of the glacial deposit is ranging from 13 to 15 m. Sediments ranging from boulder to cobble size present in the glacier, which are sub-angular to sub-rounded and inter-bedded within the granule size matrix. These glacial deposits are fluvio-glacial in origin as indicated by the mutual arrangement of the sediment and presence of erratic boulders.
At six locations, viz. Dabrani, Jhala, Harsil and Dharali; soil samples were collected and infiltration and hydraulic conductivity tests were carried out. Infiltration rate is found to vary between 1.059 to 7.413 cm/hr. The saturated hydraulic conductivity of soil in the area varies is found to vary between 0 to 47.38 cm/hour. The upper and lower part of the catchment has relatively higher conductivity than the middle part of the catchment.
Water sampling for water quality analysis was done at ten locations in the area regularly at 10-day interval during 2016 to 2020. The hydro-chemistry of groundwater was studied by using various chemo-charts. Aquachem 11.1 and ArcGIS 10.2.2 software’s were used to graphically represent the water quality data by Pi-chart, Piper, Durov and Gibbs’ plot and to create geographical maps. The chemical composition of river water constitutes about 66% bicarbonate and 31% sulphate among cations, and 62% calcium and 17% magnesium among anions. Groundwater consists of 83% bicarbonate and 15% sulphate among cations, and 40% calcium and 31% sodium among anions. Broadly both the surface and ground water indicate calcium bicarbonate dominated type of water. In river water, calcium, bicarbonate and sulfate dominate while in groundwater, calcium, sodium and bicarbonate dominate. The Piper diagram indicated that the type of groundwater is Mg-HCO3, or, Mg-Ca-HCO3 for most of the water sampling sites except for Jhala where the groundwater is found Na-HCO3 type. Durov’s diagram indicated shallow fresh groundwater in aquifer resulting from dolomite dissolution. Jhala hand pump indicates shallow portions of regional confined aquifers having ion-exchanged waters, although the generation of CO2 at depth can produce HCO3 where Na+ is dominant. Gibb’s diagram showed that almost all the water sources indicate rock dominance and are influenced by rock weathering. Overall results indicate that major ion chemistry of sub-surface water and river water is influenced by seasonal mineral dissolution and rock weathering processes in the sub-surface water. More EC in sub-surface water as compared to river water implies dissolution of minerals and salts in sub-surface water. Seasonal variations are also observed in the water chemistry of river and ground water.
Under this study, two piezometer wells were developed at Jhala and Harsil. Groundwater level monitoring was done November, 2019 onwards in both the piezometers. The groundwater levels in these piezometers vary between 3.69 to 5.55 m-bgl at Jhala, and between 0.92 to 2.80 m-bgl at Harsil. Stable isotopes of oxygen (18O) and hydrogen (2H) composition were determined using the Dual Inlet-Isotope Ratio Mass Spectrometer (DI-IRMS) (Isoprime GV instruments, U.K) with automatic sample preparation units at the Nuclear Hydrology Laboratory of National Institute of Hydrology (NIH), Roorkee (Uttarakhand). The estimated precision (measurement error) was within the limits of ± 0.1 ‰ for δ18O and ± 1.0 ‰ for δD. D-excess value was calculated using the equation given by Dansgaard (1964), i.e. δD – 8.δ18O. It was found that during evaporation, δD of the produced moisture decreases less rapidly than δ18O as compared to the slope of the GMWL, leading to samples that lie above the GMWL. It also indicated recycling of water sources, snow formation, and cooler/ dry air masses.
Seasonal effects are seen in both the river water and the groundwater. River water is found more depleted as compared to the surrounding groundwater. As the river water source is located in the Himalayan Mountains where snowmelt contributes to the isotopic depletion while groundwater is enriched as compared to the river water. Isotopic values between the river and in close proximity groundwater suggest that the groundwater is influenced to some degree by seepage from the Bhagirathi river. Groundwater and river water receive contributions from snow and glacial melt as isotopic values of groundwater and river water lie above the GMWL. It is also found from the site-wise variations of geochemistry and isotopic variations in groundwater and river water that the interactions are localized, groundwater at some sites are not influenced by river water and at some sites are influenced by the river.
Groundwater potential refers to the total amount of permanent storage that exists in the aquifers. Seven thematic layers of geomorphology, geology, geohydrology, aquifer type, soil, recharge and slope were chosen which had a major effect on groundwater potential of the area. Depending on the strength, each parameter is assigned a suitable weight. Higher value of weight has a high impact on groundwater potential and lower value of weight has lower impact on groundwater potential. Existing lithology maps of the study area, remote sensing data were used to delineate the groundwater potential zones. Weights of various parameters and sub-parameters were assigned based on previous studies as well as their relative strength.
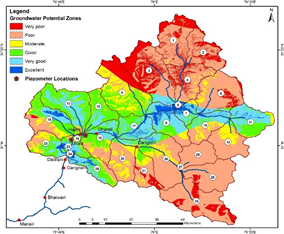
The groundwater potential zones have been identified using the index weighing scheme and classified into the six categories. After the preparation of all the thematic layers in GIS environment, they were integrated together on the basis of the normalized weights of each layer and their respective individual classes using the raster calculator tool in the ArcGIS. The aggregated raster file so obtained was then used for delineation of potential zones of groundwater on the basis of which the study area was classified into six zones viz. very poor, poor, moderate, good, very good and excellent. Based on the delineated zones, about 2.61% of study area is found under the excellent groundwater potential zone, 14.97% under the very good groundwater potential zone, 17.05% under the good groundwater potential zone, 10.78% under the moderate groundwater potential zone, 43.51% under the poor groundwater potential zone, and 11.09% falls under the very poor groundwater potential zone.
Water balance components are computed based on the SWAT outputs for the 33 sub-basins on monthly basis. However, various individual water balance components are presented subsequently for the two sub-basins, namely SB-16 and SB-21. The analysis shows two distinct precipitation cycles, one during December to April and another during June to September. The first cycle is the severe winter cycle and the second precipitation cycle is the more intense monsoon cycle. July to September is the main ablation period during which major part of snow melt runoff occurs. ET is minimum during January and February and maximum in July and August. Maximum percolation occurs July and August. Runoff variation also follows the similar trend as of percolation and maximum runoff occurs during July and August. Variation of monthly base flow contribution shows that base flow occurs during all the months of the year. Maximum water yield occurs during the month of July and August. Interflow increases from the month of April to July/August and then show a declining trend up to November and thereafter there is negligible interflow during December to March. The trend of variation of recharge is almost similar to the monthly variation of base flow. It is also seen that recharge takes place during all the months of the year. Variation of infiltration follows similar kind of trend like interflow. Infiltration increases from the month of April to July/August and then show a declining trend up to November. Small amount of infiltration also occurs during the winter season.
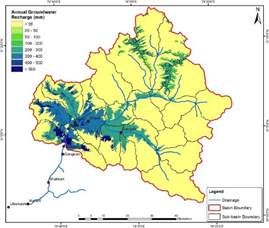
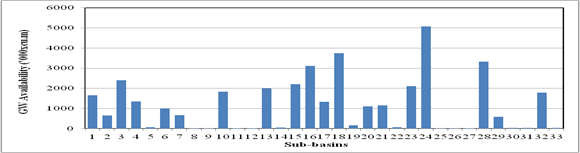
The groundwater availability was estimated in various sub-basins and presented in the report. Some sub-basins have very low groundwater availability depending on the local conditions and underground formations to receive the recharge. The groundwater availability in various sub-basins varies up to 508 ham.
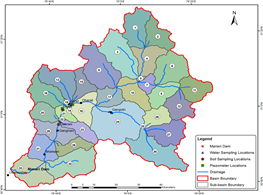
The SWAT model divided the watershed into 33 sub-basins and 656 HRUs. And was used to find water balance components in the basin. Various sub-basins of the study basin are shown in Figure – 3 while the estimated groundwater availability in these sub-basins is presented in Figure – 4.
About 2.61% of the study area is found under the excellent groundwater potential zone, 14.97% under the very good groundwater potential zone, 17.05% under the good groundwater potential zone, 10.78% under the moderate groundwater potential zone, 43.51% under the poor groundwater potential zone, and 11.09% falls under the very poor groundwater potential zone.