List of CBEs Spatially Distributed in UGB
|
Sl. No. |
Administrative districts |
Area falling in UGB in sq km (% area w.r.t total basin area) |
Number of recorded EREs/ CBEs |
No. of blocks with EREs/ CBEs |
ERSs/CBEs density |
|
1 |
Chamoli |
7455 (34%) |
23 |
6 |
0.003 |
|
2 |
Rudraprayag |
1987 (9%) |
8 |
3 |
0.004 |
|
3 |
Tehri Garhwal |
3280 (15%) |
13 |
5 |
0.0039 |
|
4 |
Uttarkashi, |
4934 (23%) |
5 |
2 |
0.001 |
|
5 |
Pauri Garhwal |
2687 (12%) |
7 |
5 |
0.002 |
|
6 |
Bageshwar |
566 (3%) |
1 |
1 |
0.0017 |
|
7 |
Pithoragarh |
392 (2%) |
- |
- |
- |
|
8 |
Kinnaur (H. P.) |
313 (1%) |
- |
- |
- |
|
|
Total |
21614 (100%) |
57 |
22 |
0.0026 |
Elevation-wise Number of EREs/ CBEs, Villages, and Population in The UGB
|
Elevation (m) |
No. of villages |
Population |
EREs/ CBEs |
|
< 1000 |
958 |
207705 |
6 |
|
1000 - 2000 |
4269 |
1084468 |
38 |
|
2000 - 3000 |
412 |
147174 |
4 |
|
> 3000 |
63 |
12420 |
9 |
|
Total |
5702 |
1451767 |
57 |
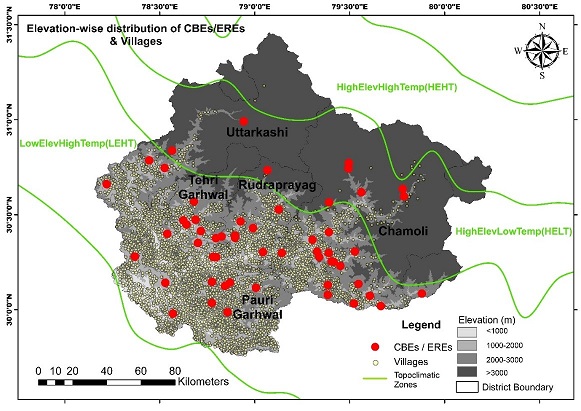
Distribution of EREs/ CBEs W.R.T Elevation, Village, and Population Across UGB.
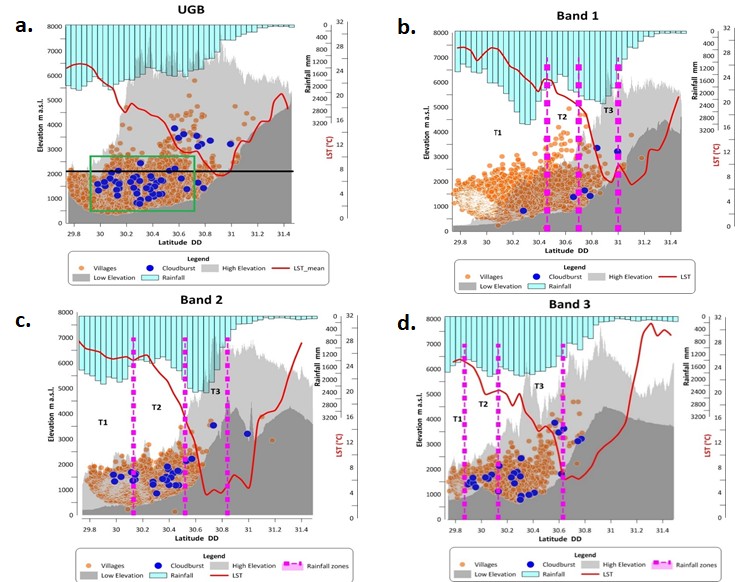
Plot Showing EREs/CBEs W.R.T Regional High/Low Elevation, Precipitation, Temperature, and Villages for UGB, Band 1, Band 2, and Band 3. Vertical Pink Lines Show Rainfall Zones Based on Two-step Topography by Bookhagen and Burbank, 2010.
The spatial distribution of extreme events and their recurrence in the UGB was studied to
identify vulnerable administrative blocks. The vulnerability and associated risk was assessed
using hazard, exposure, vulnerability and adaptive capacity. Four categories of blocks were
identified in the populated areas of the basin. Blocks which experienced more than five events
during the past ten years are classified as severely vulnerable blocks. Two blocks, Bhilangana
in Tehri Garhwal district and Joshimath block in Chamoli district are under this category.
Joshimath, Bhilangana, Bhatwari are classified as highly vulnerable blocks followed by Ukhimath,
Dasholi, Deoprayag, Jakholi, Tharali, and Narayanbagad having moderate to low vulnerability. The
total population of 3,35,750 (23% of UGB) in the severe to high vulnerability blocks are under
severe risk. The 75% population of UGB living in the elevation band of 1000-2000 m a.s.l. is
also under higher risk as compared to other regions of the basin as discussed earlier. These
findings will help the government in prioritizing its policy interventions and formulate
targeted block level implementation for disaster risk reduction (DRR). UGB has large high
elevation uninhabited area covered by glacier and snow cover with low risk areas.
Vulnerability = (Exposure - Adaptive Capacity) x Sensitivity ..............................(1)
Risk = Hazard x Vulnerability .......................................................................(2)
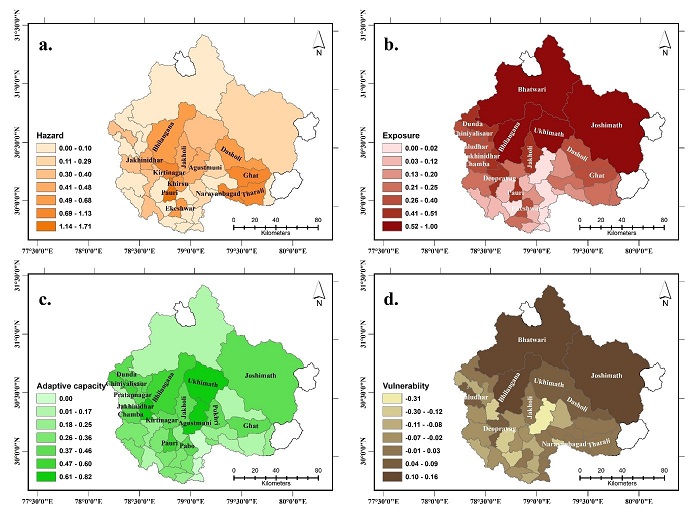
Map Showing a. Hazard, b. Exposure, c. Adaptive Capacity, and d. Vulnerability in The UGB.
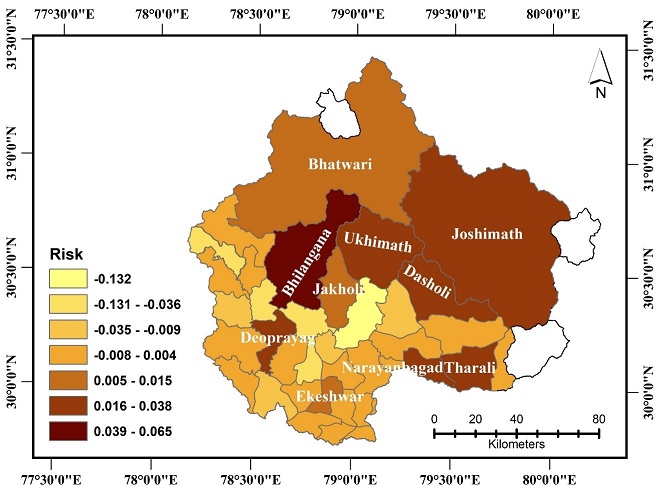
Extent of Risk Associated of EREs/ CBEs in Different Blocks in UGB
Study Area
Inventory of Cloudburst Events (CBEs) and Villages
Formulation of Questionnaire
Field Visits